創(chuàng)建地形的方法有很多���,今天我們就介紹如何用dynamo去創(chuàng)建地形并與revit進行交互�����。
思路:
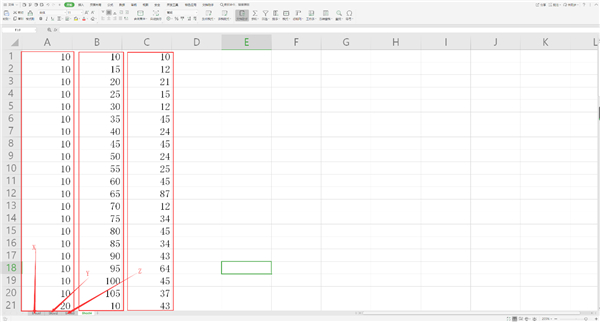
運用dynamo去識別excel表格中的數據值作為地形點陣來創(chuàng)建地形�����,將地形點的三個坐標值(XYZ)記錄在Excel表格中����,創(chuàng)建相關節(jié)點將表格中的數據導入到dynamo程序中,要準確的將三個坐標值對應到每個點����,這里有兩種記錄數據的方法:
(1)將X、Y�����、Z值分別記錄在同一個文檔中��,拆成三個表�,將X、Y�、Z的值分開導入到dynamo中,再使其變成點陣��,最后生成地形���。
(2)將X�����、Y�、Z值分別記錄在同一個文檔的一個表中,轉置后去識別表格中X��、Y�����、Z值���,再使其變成點陣,最后生成地形����。
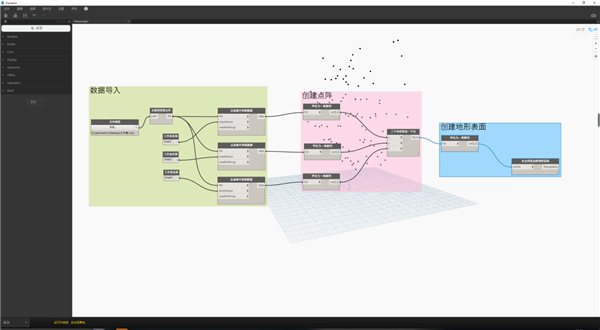
方法(1)
數據記錄,將數據拆成三個表
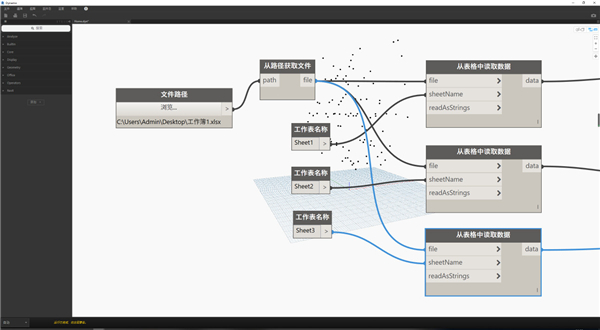
將excel表格的數據導入dynamo中
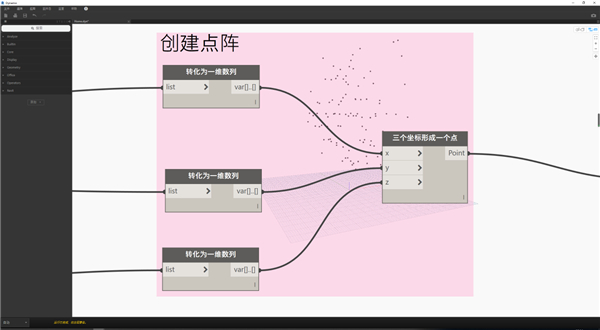
使用導入的數列創(chuàng)建點陣
在revit中創(chuàng)建地形
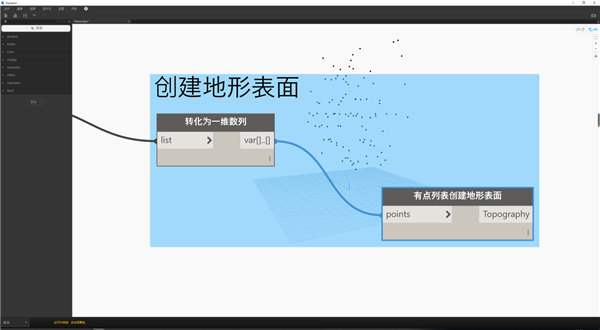
創(chuàng)建完成后的節(jié)點及revit中地形
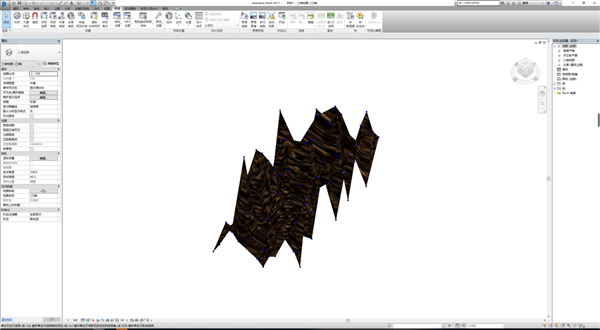
由于地形數據是隨機錄入的�����,生成的地形高低起伏較大�����。
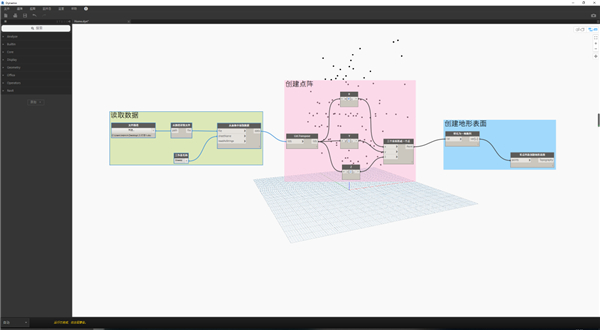
方法(2)
數據統(tǒng)計方式不一樣�����,讀取數據和創(chuàng)建點陣需要用到數據的節(jié)點也會不同,創(chuàng)建完成后的節(jié)點如下圖所示����,創(chuàng)建出來的地形是一樣的。


 豫公網安備 41100202000396號


")
績")
